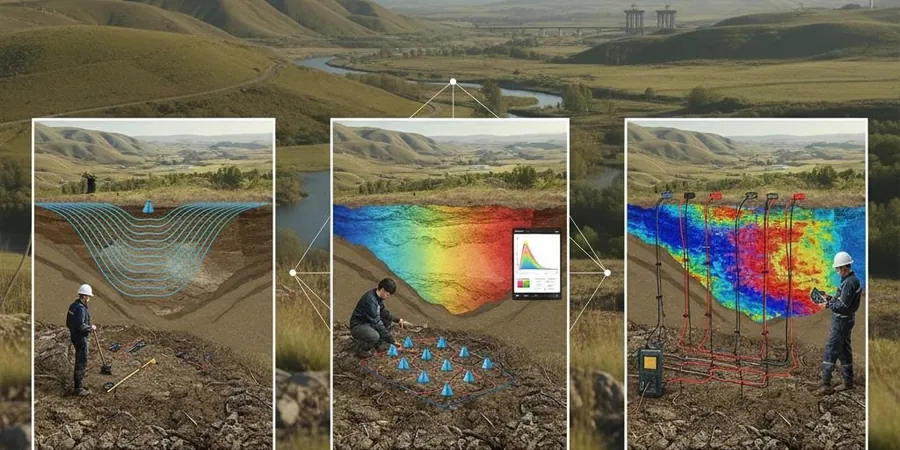
Sitting barely 12 metres above sea level on the northern bank of the Thames Estuary, Southend-on-Sea presents a subsurface where the transition from soft alluvial clays to the underlying London Clay and Thanet Sand can shift dramatically within a single development plot. Our seismic tomography surveys map that transition without guesswork. The method uses controlled surface energy sources and high-density geophone arrays to measure P-wave and S-wave travel times, which are then inverted into 2D or 3D velocity sections. For projects in the Victoria Avenue corridor, where the estuarine deposits thin out, we have resolved the bedrock profile to within half a metre. The output integrates directly with the ground model required under Eurocode 7, giving the designer a continuous cross-section rather than isolated borehole logs. Because Southend sits on the London Basin margin, the velocity contrast between the superficial deposits and the deeper Lambeth Group is sharp enough to produce clear refractor picks even in noisy urban settings.
A continuous velocity cross-section replaces interpolation between boreholes with measured data, cutting uncertainty in the ground model where Southend's alluvial layers pinch out.
Local context
The Thames Estuary alluvium in central Southend reaches thicknesses that can mask a buried channel feature — the former course of the Prittle Brook or a tributary — where the fill is loose, water-saturated sand with a high liquefaction susceptibility. A borehole grid alone can miss the channel edges, but a seismic refraction line with a 3-metre geophone spacing detects the velocity pull-down caused by the thicker low-velocity fill. In one survey near the A127 underpass, a 12-metre-wide soft zone was identified that would have required ground treatment had the piles been placed without the tomographic section. The risk of differential settlement is amplified where the London Clay surface is irregular, and reflection tomography clarifies the dip direction and magnitude of that unconformity before excavation begins. Our processing chain includes static corrections for the tidal influence on the near-surface, because the saturated alluvium can show a velocity shift of up to 15 % between low and high tide.
Common questions
What depth can seismic refraction reach in Southend-on-Sea's ground conditions?
With a standard 69-metre spread and accelerated weight drop, we routinely resolve the London Clay top and the Thanet Sand interface at 15 to 30 metres depth. For deeper targets, we increase the offset and use a heavier source or supplement the line with reflection acquisition to reach the Chalk at 50 metres or more.
How much does a seismic refraction survey cost for a typical Southend residential plot?
A single 69-metre refraction line with 24-channel acquisition, including processing and a factual report, ranges from £2.030 to £3.560 depending on site access, traffic management requirements and the number of shot points needed for adequate fold.
Can seismic tomography distinguish between the Alluvium and the London Clay beneath Southend?
Yes. The P-wave velocity contrast is typically sharp: the saturated Alluvium sits around 1.450–1.600 m/s while the weathered London Clay starts above 1.800 m/s. The refractor is clearly visible on the first-break travel-time curves, and the tomographic inversion maps the undulating interface along the entire profile.